
Quantifying Skill in Sports with True Score Theory
Published:
Our everyday experiences depend on a mix of deliberate skill and unpredictable chance. Is there a way to quantify this balance?
I recently read The Success Equation by Michael Mauboussin, a book aimed at disentangling luck and skill to help us make better decisions. As human beings, we like to create stories of cause and effect which can lead us to misattributing outcomes to our own skill when, in fact, it might have just been pure luck.
In this post, I use Mauboussin’s framework to quantitatively examine the role of luck and skill in sports and e-sports. Do teams win more often in some sports due to luck? Are there sports that better measure the skill of their competitors?
True Score Theory
In his book, Mauboussin uses a simple model from True Score Theory to distinguish between skill and luck. Let’s break down how it works:
True Score Theory models an outcome as the sum of two factors: true skill and random error (which we’ll refer to as luck):
\[\text{Outcome} = \text{Skill $+$ Luck}\]In reality, we only observe the outcome and can’t directly see the contributions of skill and luck. To analyze this, we take the variance of both sides:
\[\text{Var}(\text{Outcome} ) = \text{Var}(\text{Skill $+$ Luck})\]Since \(\text{Skill}\) and \(\text{Luck}\) are independent random variables, the variance of their sum is the sum of their variances:
\[\text{Var}(\text{Outcome}) = \text{Var}(\text{Skill}) + \text{Var}(\text{Luck})\]From here, we can calculate how much luck contributes to the overall outcome: \(\% \text{ Luck} = \frac{\text{Var}(\text{Luck})}{\text{Var}(\text{Outcome})}\)
To calculate the percentage of luck, we substitute win percentages for the variables and do the following procedure:
- Calculate the variance of win rates across the league: \(\text{Var}(\text{Win Rates})\).
- Estimate the variance of win rates if the outcomes were based purely on luck. If every team had a \(50\%\) chance of winning each game, wins would follow a binomial distribution. The variance in this case is: \(\text{Var}(\text{Luck}) = \frac{0.5 \cdot (1 -0.5)}{n} = \frac{0.25}{n}\)
The formula for the percentage of luck becomes:
\[\% \text{ Luck} = \frac{0.25}{\text{Var}(\text{Win Rates}) \cdot n}\]Notice, the larger the number of games \(n\), the smaller the impact of luck. In other words, as more games are played, skill differences become more apparent. Oakland A’s general manager, Billy Beane famously said,
My s– doesn’t work in the playoffs. My job is to get us to the playoffs. What happens after that is f–ing luck.
Additionally, a higher variance in win rate reflects a greater influence of skill. Skilled teams consistently winning more than weaker teams, will increase the win rate variance (i.e. ), meanining less room for randomness or luck to affect outcomes.
Luck in popular sports
Remember, the \(\% \text{ Luck}\) quantifies how well a particular sport measures the skill of its players. With this in mind, let’s take a look at a few of the most popular sports:
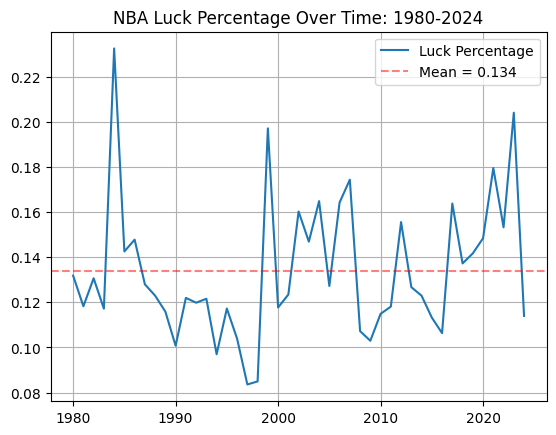
NBA
Using NBA data from kaggle, I calculated luck percentage for every season since 1980:
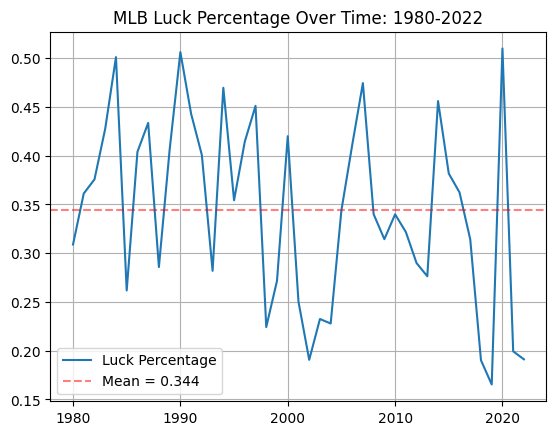
Baseball
Using MLB data from this github page, I calculated the luck percentage from 1980 to 2022.
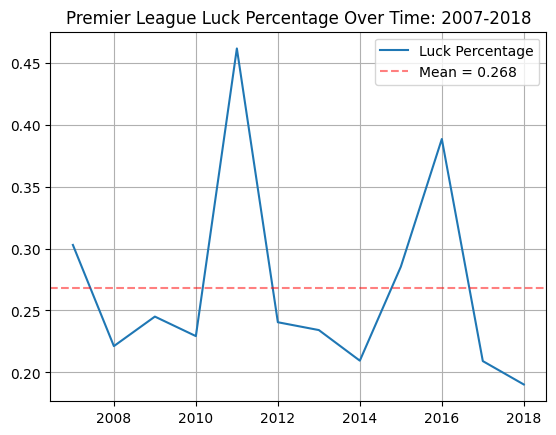
Soccer
Using Premier League data from kaggle, I calculated the luck percentage from 2007-2018.
Tennis
Using ATP Tennis data from Ultimate Tennis Statistics, I calculated the luck percentage based on the lifetime winrates of 582 players in the database to be \(5.6\%\)
Discussion
Ranking luck contribution:
| Sport | Percentage of Luck |
|---|---|
| 1. Tennis | \(5.6\%\) |
| 2. Basketball | \(13.4\%\) |
| 3. Soccer | \(26.8\%\) |
| 4. Baseball | \(34.4\%\) |
Why are the sports ranked in this particular order?
Number of scoring opportunities: Sports with more frequent scoring events reduces the influence of a single lucky/unlucky moment. Tennis and basketball have numerous scoring opportunities while the outcome of a baseball or soccer game might depend on a single shot/hit.
Number of players: The fewer the players, the more opportunities there are for skilled players to gain control of the game (and for weaker players to hurt their team).
- Singles tennis is 1v1, giving control to each player on every point. Individual skill and decisions play the strongest role in the outcome of a match
- Basketball involves 5v5 play, so the combination of a small team and a lot of opportunities to score allows for individual stars to carry the team.
- With much larger teams, soccer and baseball players get control of the ball only a few times. The small sample size means star players can’t impact the game as easily.
External conditions: Baseball is particularly prone to external conditions. Wind, stadium size, or the umpires’ individual biases might be the difference between a home run and an out. Even though tennis is played outdoors and on different surfaces, conditions are relatively consistent for both players throughout the match.
While I could list a few other reasons such as the strategic complexity and game duration, I believe the 3 factors above work extremely well for determining how well sports measure their respective players’ skill.
Conclusion & additional notes
One important concept to note is that provided the luck contributon stays the same, uniform increases in skill across all competitors will lead to the luck percentage increasing. With more evenly matched teams, chance plays a larger role in determining outcomes. I wish this would have been more evident in the data, but because teams don’t play 200+ game seasons, it was harder to see the trend.
As a casual gamer, I think it would be interesting to look at variances for e-sports such as League of Legends, Valorant, and Counter Stike. Maybe I’ll look into that in my next post.