
Deciphering Desirability: Patterns in Speed Dating

Introduction
Choosing a romantic partner is one of the most significant decisions people make. Speed dating offers a unique and accelerated glimpse into the dynamics of interpersonal attraction. In this study, we examine how people make quick decisions about potential partners using data from over 6,000 speed-dates collected in the early 2000s.
This analysis aims to identify the traits that most strongly influence partner selection, explore differences in preferences between men and women, and assess whether these preferences align with what participants claim to value.
The Data
Source and experiment description
The data were originally downloaded from Columbia statistician Andrew Gelman’s website. The dataset itself was compiled by Columbia Business School professors Ray Fisman and Sheena Iyengar for their paper Gender Differences in Mate Selection: Evidence From a Speed Dating Experiment.
From 2002-2004, researchers gathered data from volunteers consisting of graduate and professional students from Columbia University. At a local bar/restaurant near the university, participants would have four-minute speed dates with every other participant of the opposite sex. After each date, participants rated their date on six attributes: Attractiveness, Sincerity, Fun, Intelligence, Ambition, and Shared Interests. Perhaps most importantly though, participants were asked if they would like to see their date again.
Throughout the experiment, researchers also gave participants questionnaires to gather data on participant demographics, preferred partner attributes, dating habits, and perceptions of how the general population approaches dating.
Cleaning
Initially, the dataset contained 8,379 speed dates between the 552 unique participants with 192 variables.
For consistency, we removed 4 out of the 22 speed dating groups (waves 6-9) which utilized a separate rating/scoring scheme. We also removed 141 variables from the data set for simplification purposes. Participants were given multiple follow-up surveys with the same questions on dating preferences. We removed these variables due to irrelevance or containing many missing values (participants were much less likely to fill out surveys given to them 3-4 weeks after their speed dates). With the remaining data, we also omitted speed dates containing large amounts of missing values (e.g. no ratings for their partner).
The resulting data set contains 6,761 total speed dates with 224 male and 220 female participants. We kept 51 variables relating to demographics (race, age, field of study), hobby interests, dating values, and partner ratings.
Exploratory Data Analysis
Before attending their speed dates, participants were questioned on traits they value in a partner. Specifically, they were given 100 points to distribute among the six attributes of interest: Attractiveness, Sincerity, Fun, Intelligence, Ambition, and Shared Interests. Separating participants by gender, we first examine the distributions.
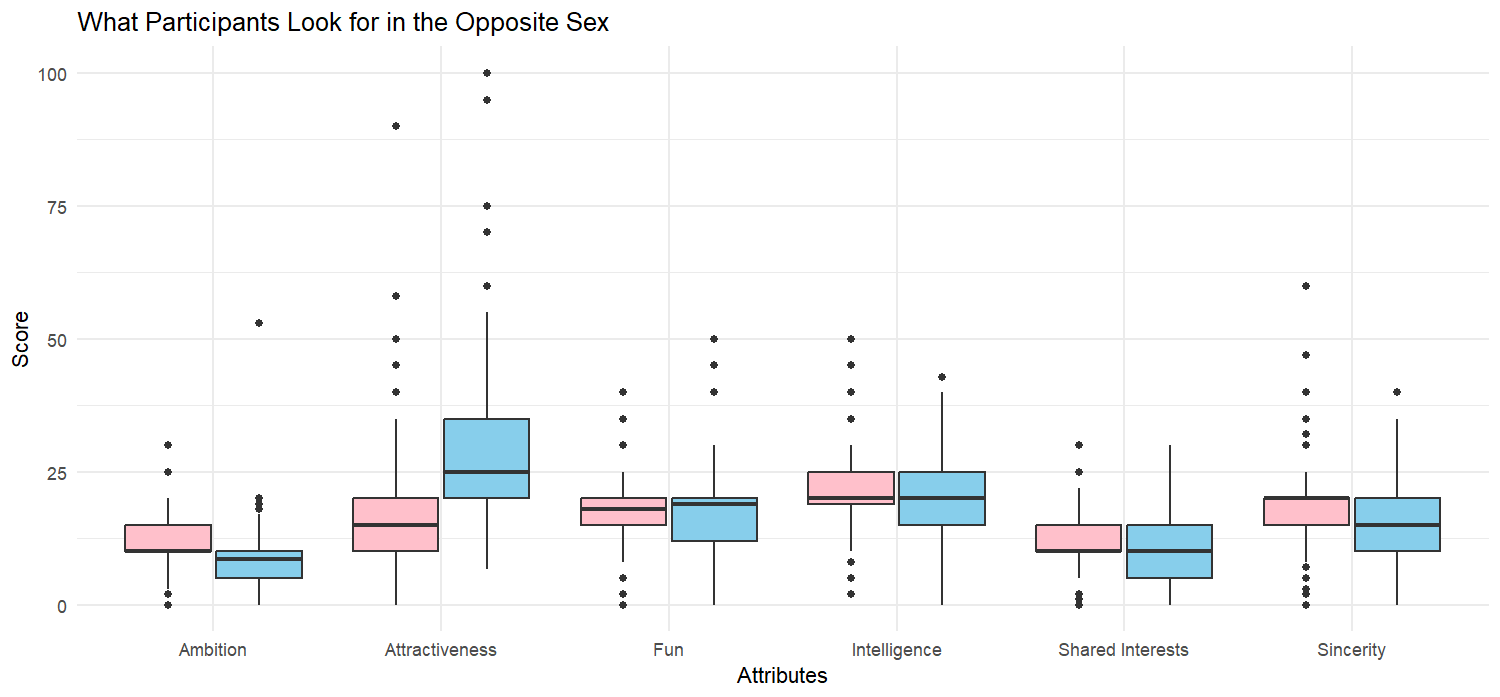
Immediately, we see that men claim to value attractiveness, much more so than women. Women claim intelligence to be the most important attribute on average. However, for the most part, women value each of the 6 traits relatively equally.
At a second glance, the box plots hint at a difference in men’s and women’s score variations. To examine this further, we estimate confidence intervals via a bootstrap procedure by sampling participants with replacement.
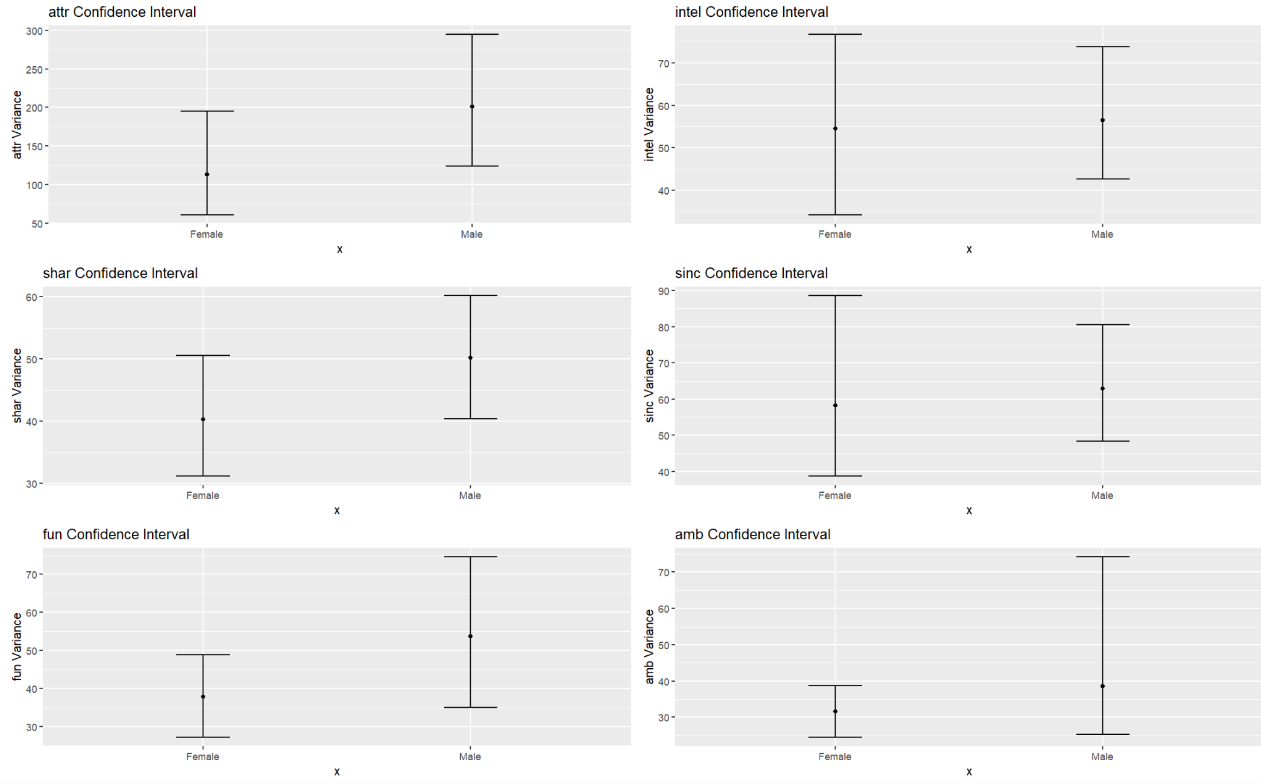
The above plots show a 99% confidence interval of the variance in men’s and women’s attribute importance. We note that the confidence intervals for each attribute overlap, preventing us from making any definitive statistical conclusions. However, variance in the attributes Attractiveness, Shared Interests, and Fun for male responses tend to trend higher than for women. Going forward, we keep in mind that male preferences may be less selective than for women.
Next, we turn our attention to what participants think most others of the same sex look for in a partner (see Figure 3).
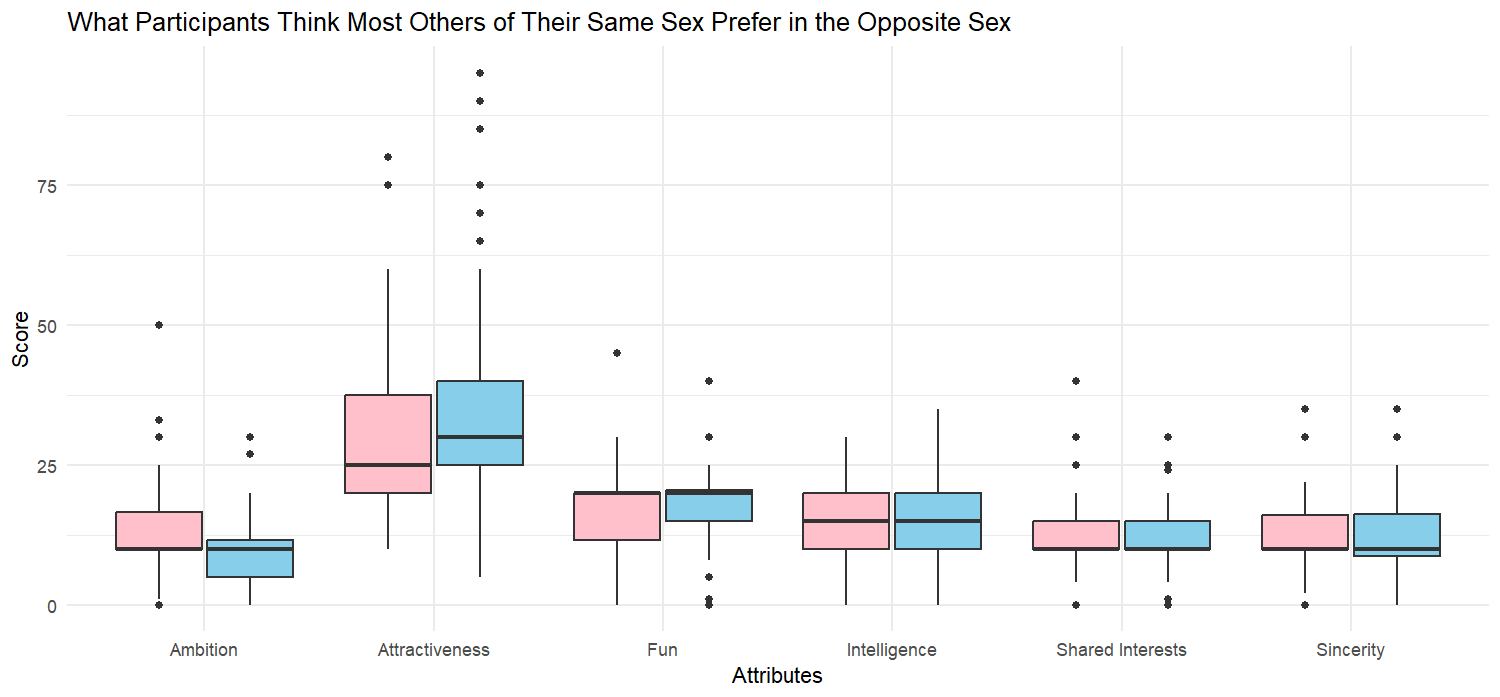
Compared to the first set of box plots, we note that men tend to think other men have similar preferences to themselves. On the other hand, women tend to think other women value attractiveness much more than themselves. As an overall trend though, participants claim to value intelligence and sincerity more than most of their peers and claim to value attractiveness and fun less than most of their peers.
Let us now investigate what participants think most members of the opposite sex value (Figure 4).
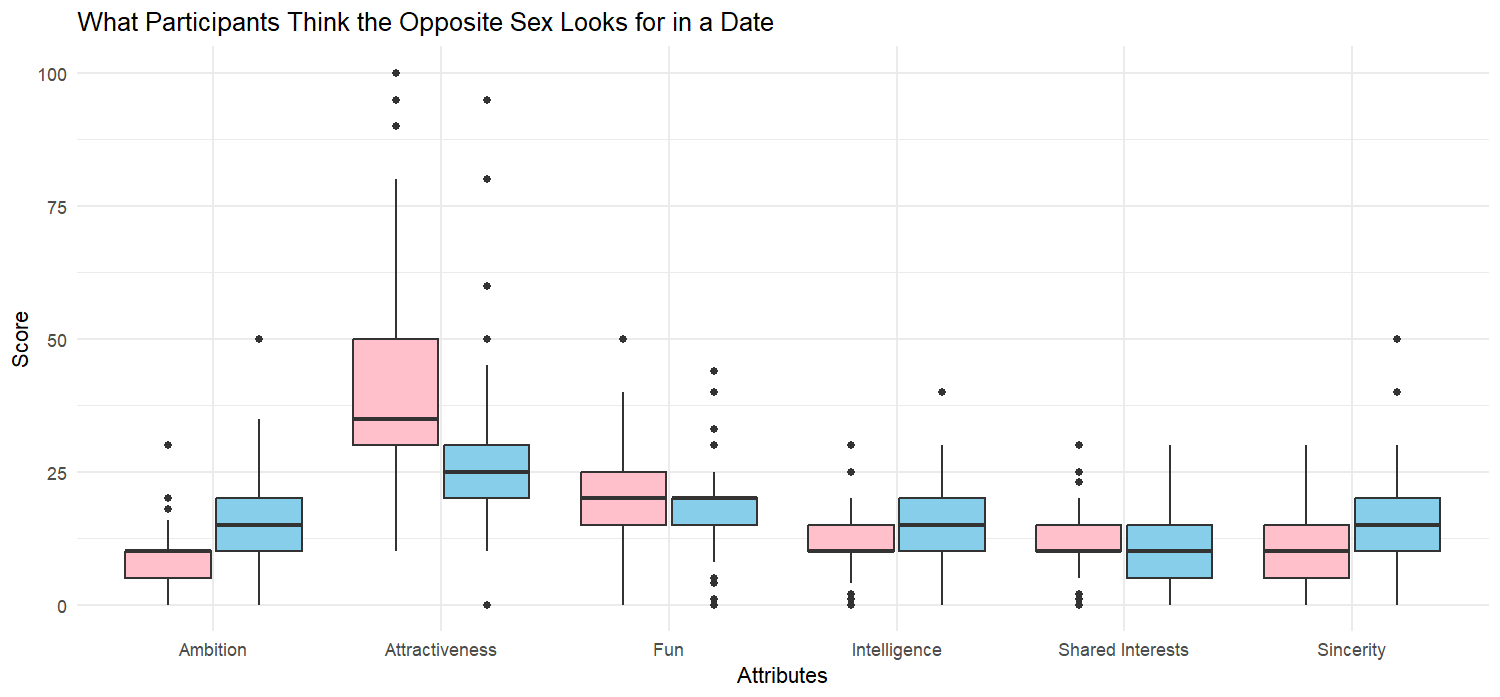
While women correctly predict that men value attractiveness the most, they overestimate its importance (compared to what men claim to value). Men predict women value attractiveness the most, but less so than women believe other women do. For other attributes (except ambition), the perceived importance is relatively similar between the genders, with only slight variations.
Finally, we analyze the frequency of participants wanting to see their partner again (the “yes” rate) as the night progresses:
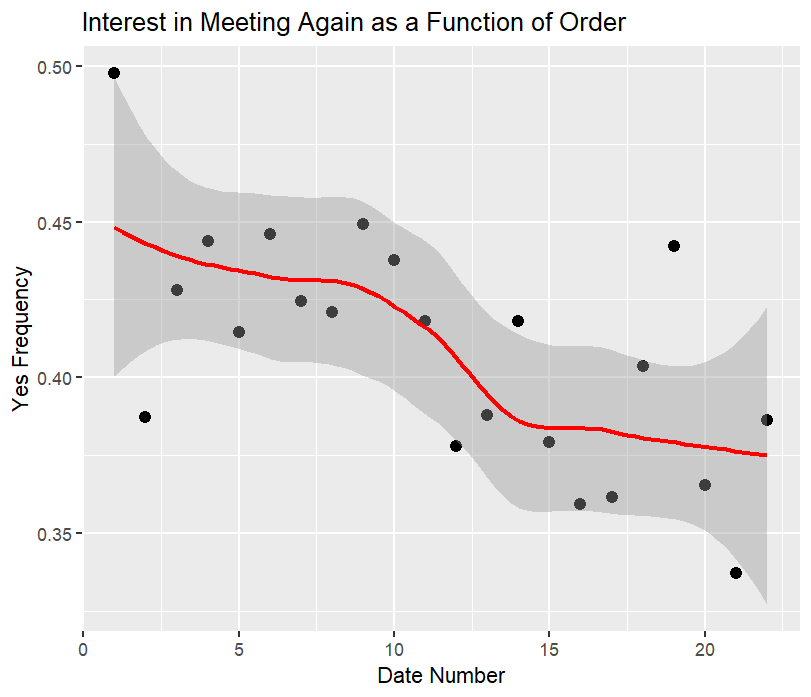
The above plot shows the relationship between participant decisions and the order of the speed date with a LOESS regression line and standard error. The declining trend might suggest participant fatigue or diminishing enthusiasm as they proceed through multiple dates. Another potential explanation could be that earlier dates are perceived as more novel or exciting, while later dates might suffer from comparison or reduced attention.
Let’s now separate the overall trend into the male and female groups:
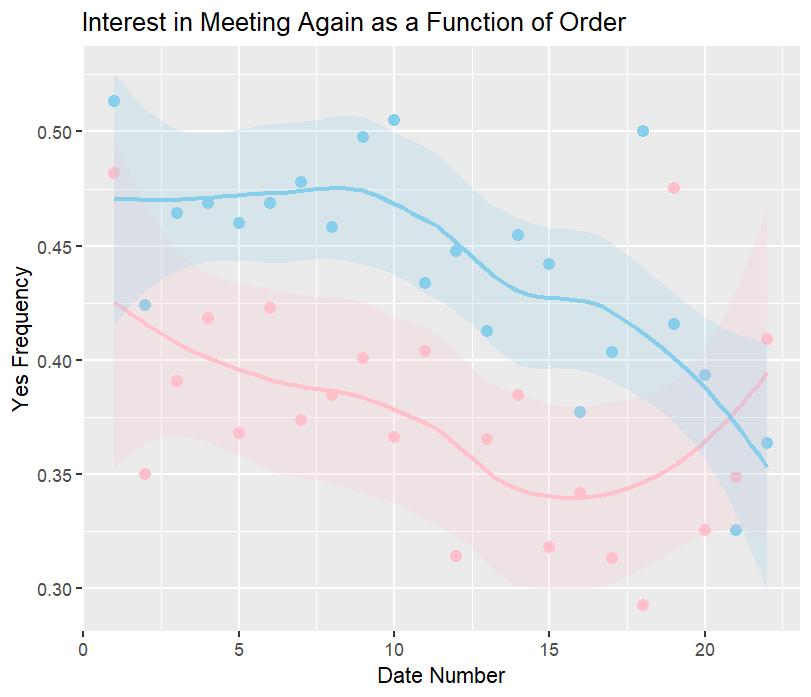
Men consistently have a “yes” frequency much higher than women, indicating less selectivity with their partners. The general declining trend still holds but at different rates, most notably after about date 15. These later set of dates show a sharp decline in male “yes” frequency, but a noticeable upturn in female “yes” frequency. We will not further investigate these phenomena or the outlier dates statistically. The differences might be due to evolving male and female dating strategies throughout the night.
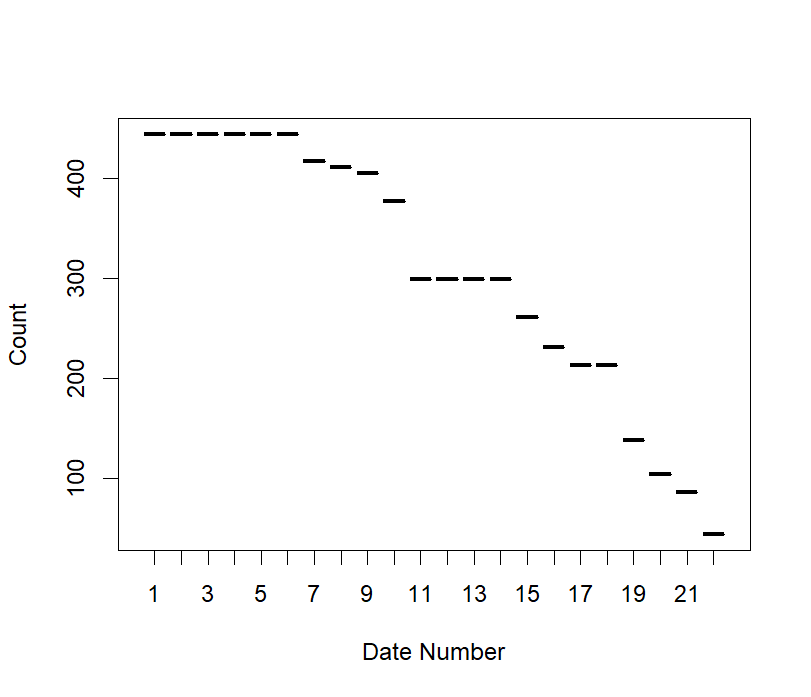
An important note is that not every participant would go on the same number of dates. With varying group sizes, some participants might have gone on 10 dates while others had 22:
Analysis
In this section, we discuss the construction, interpretation, and downsides of a logistic regression model.
Feature Selection
We aim to build a relatively simple and interpretable logistic model that predicts participant decisions. To begin, we consider 8 variables of interest:
- attractiveness rating
- fun rating
- intelligence rating
- shared interest rating
- ambition rating
- sincerity rating
- interest correlation
- round number
An important distinction to make is between shared interest rating and interest correlation. As part of the initial questionnaires, participants were asked to rate their interest on a scale from 1-10 in 16 different activities such as exercise, gaming, art, movies, and concerts. As the name suggests, interest correlation considers both participants’ scores (reported interest) in these activities. Shared interest on the other hand is a participant’s rating of the shared interests they perceive their partner to have.
Because rating a partner is subjective, we combat variable correlation by checking for collinearity using the variance inflation factor (VIF) and a correlation matrix:
| Attractiveness Rating | Fun Rating | Intelligence Rating | Shared Interest Rating | Ambition Rating | Sincerity Rating | Interest Correlation | Round Number |
|---|---|---|---|---|---|---|---|
| 1.18 | 1.66 | 2.11 | 1.32 | 1.74 | 1.81 | 1.00 | 1.00 |
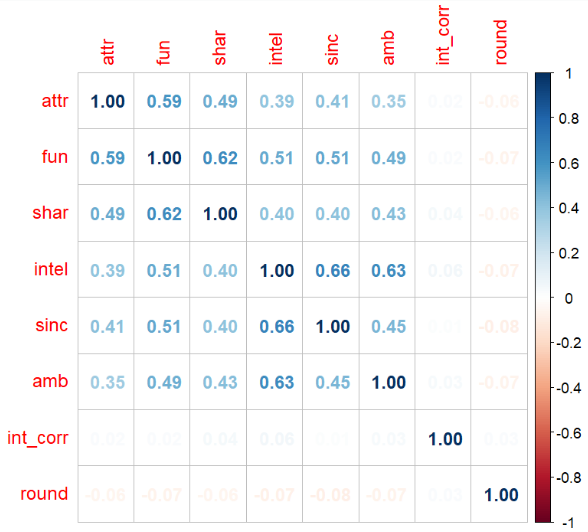
Using the rule of thumb for excluding variables with a VIF \(> 5\), we note that each variable sits comfortably below this threshold. Looking at the correlation matrix, however, we see a few pairs of highly correlated variables:
- attractiveness, fun
- fun, shared interest
- intelligence, sincerity
- intelligence, ambition
Therefore, to avoid problematic collinearity issues, we will only consider attractiveness, shared interest, intelligence, interest correlation, and round number for constructing the model.
Logistic Models
We first build multiple logistic models to get a sense of the most important traits. For each trait, we build 3 different models: one for the entire data set, one for men, and one for women.
| Overall | Male | Female | |
|---|---|---|---|
| Attractiveness | 0.570 | 0.739 | 0.604 |
| Sincerity | 0.454 | 0.426 | 0.484 |
| Intelligence | 0.317 | 0.297 | 0.356 |
| Interest Correlation | 0.086 | -0.072 | 0.256 |
| Round Number | -0.0038 | -0.0035 | -0.0043 |
The above table shows the logistic regression slope coefficients for each model. With the aim of building the model that most efficiently utilizes the 5 variables of interest, we build a sequence of logistic models starting with the highest coefficient variable (in this case attractiveness). In each subsequent iteration, we add the variable with the next highest coefficient. We consider the model with the lowest AIC to be the best among the 5.
In every case (overall, male, female), we find the lowest AIC models use only attractiveness, shared interest, intelligence, and interest correlation:
| Overall | Male | Female | |
|---|---|---|---|
| Intercept | -5.36 | -5.27 | -5.65 |
| Attractiveness | 0.572 | 0.681 | 0.462 |
| Sincerity | 0.316 | 0.297 | 0.342 |
| Intelligence | 0.042 | -0.124 | 0.056 |
| Interest Correlation | 0.110 | -0.172 | -0.043 |
Based on the coefficients alone, physical attractiveness is (unsurprisingly) the most important factor in a participant wanting to go on a second date. Surprisingly, \textit{perceived} shared interest is the model’s second most important variable. From our earlier exploratory data analysis, we saw that both men and women did not claim shared interests to be particularly valuable. In contrast, the interest correlation (calculated as the correlation of hobby and activity interests) seems to play a minor role in second-date decisions. The slightly negative coefficient for interest correlation suggests a more complex underlying dynamic, where highly similar interests do not necessarily translate to a higher likelihood of a ``yes” decision.
The earlier analysis showed women valued all attributes roughly equally, with a slight preference for intelligence. However, our logistic model indicates that intelligence has little impact, with a near-zero coefficient. For men, the model reveals that intelligence negatively affects the probability of a ``yes” decision, despite men rating it as relatively important.
Model Interpretation
To interpret the model coefficients better, we conduct a bootstrap procedure to generate a 99% confidence interval for the odds ratio of each variable:
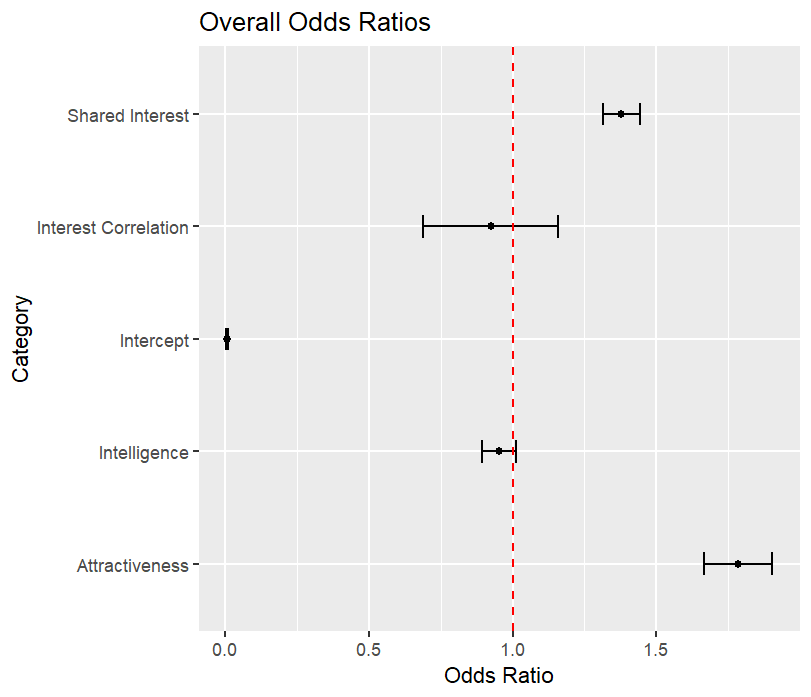
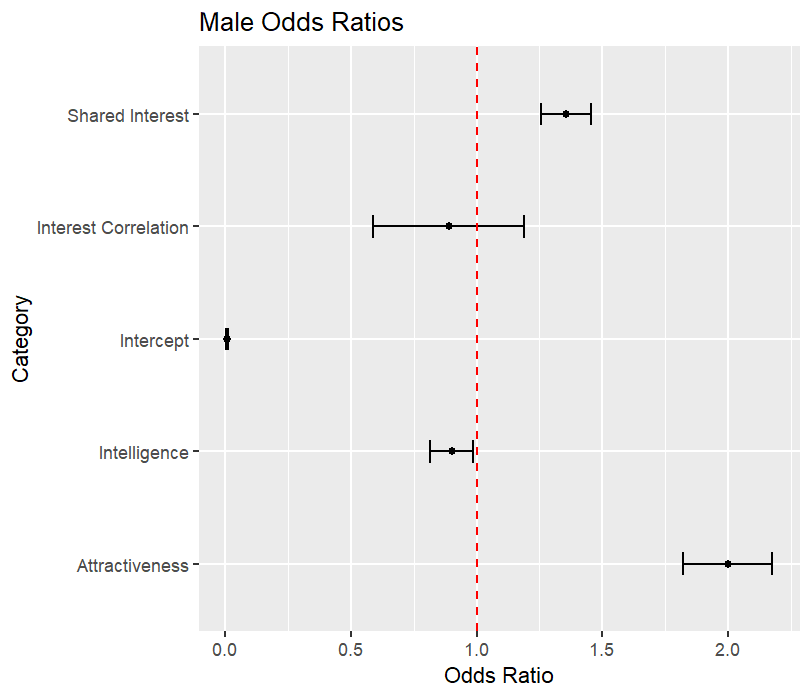
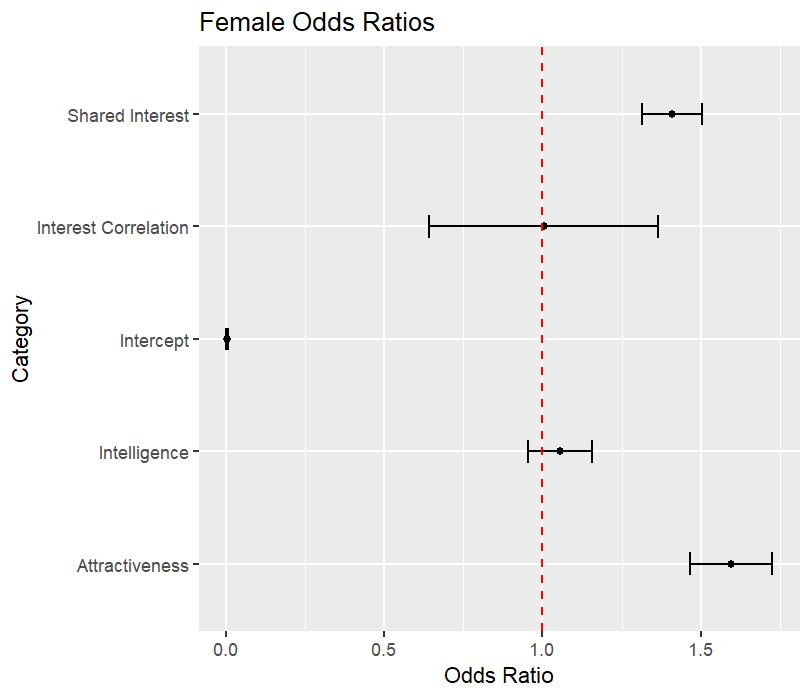
We easily conclude that attractiveness and shared interest greatly affect a participant’s decision. In fact for men, each additional point higher they rated their partner roughly doubles the chance they want to go on a second date. Similarly, for women, each additional point increases the odds by about 60%.
For women, since the interest correlation and intelligence odds ratios contain 1, we cannot conclude they have any impact on the odds of going on a second date. For men, interest correlation also appears to have no effect, but the upper bound for the intelligence confidence interval is \(0.987\). Each additional point higher men rated their partner’s intelligence decreases the chance of a “yes’’ decision by at least 1%.
Due to the brevity of 4-minute speed dates, participants have little time to assess their partner’s intelligence or fully explore shared interests. Consequently, they may rely more heavily on physical attractiveness when making their decision, even more so than they would on a longer date. Still, the model depends on perceived shared interests. These perceptions may be influenced by factors such as body language, conversational flow, and immediate emotional connections, rather than a deep understanding of common interests.
Model Strengths and Weaknesses
Using a threshold of \(0.5\) for the model predicting a “yes” decision, we calculate a confusion matrix for each of the 3 models:
| Metric | Overall | Male | Female |
|---|---|---|---|
| True Positive | 0.2794903 | 0.3386931 | 0.2312760 |
| False Positive | 0.1100396 | 0.1262402 | 0.1050624 |
| True Negative | 0.4618564 | 0.4016421 | 0.5114424 |
| False Negative | 0.1486137 | 0.1334246 | 0.1522191 |
Summing the prediction fractions, we find the accuracy for each model:
| Metric | Overall | Male | Female |
|---|---|---|---|
| Accuracy | \(74.1\%\) | \(74.0\%\) | \(74.4\%\) |
The model performs slightly better on women than men, possibly explained by men’s wider preference range. Men have much higher proportions of true positive and false positive rates than women, and vice versa. Recalling that men tend to say ``yes’’ more frequently than women, and place much more value on attractiveness the distribution makes sense. But let us look further into how each group rated their dates:
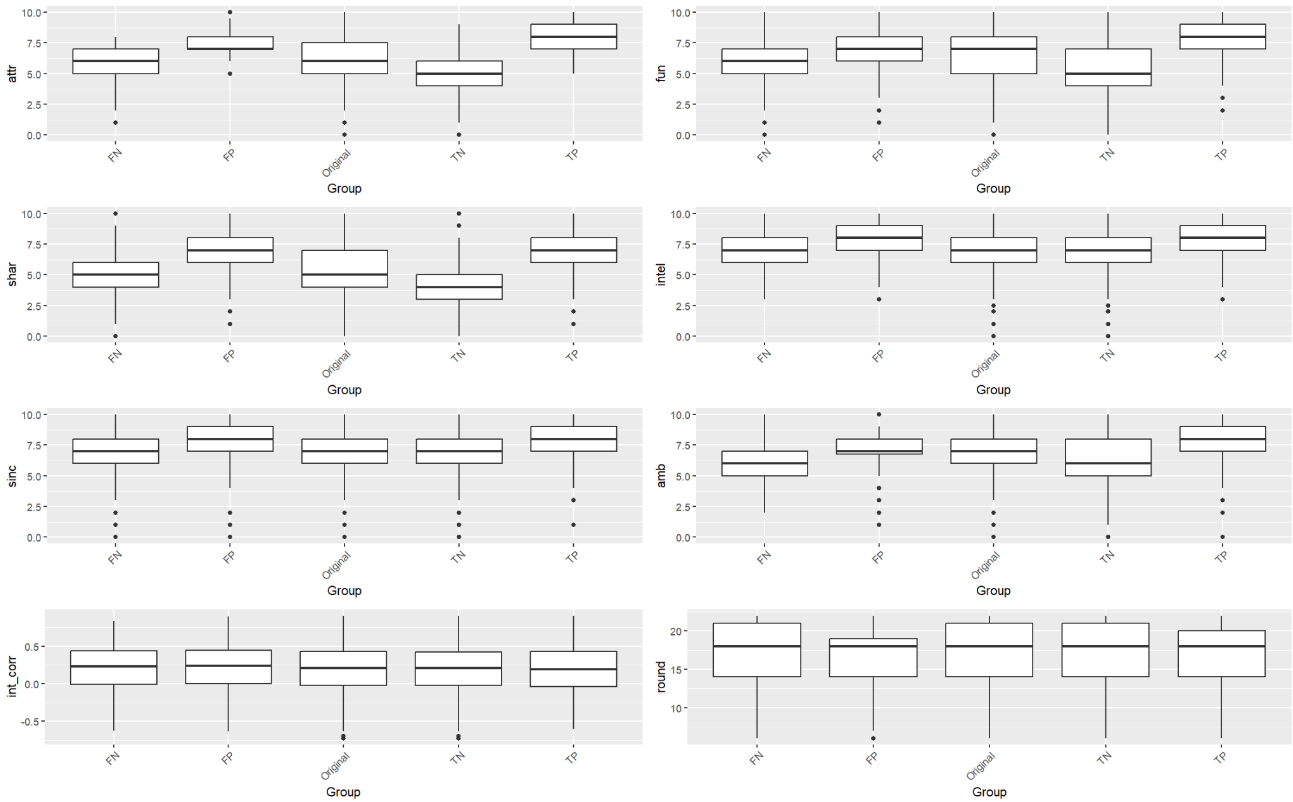
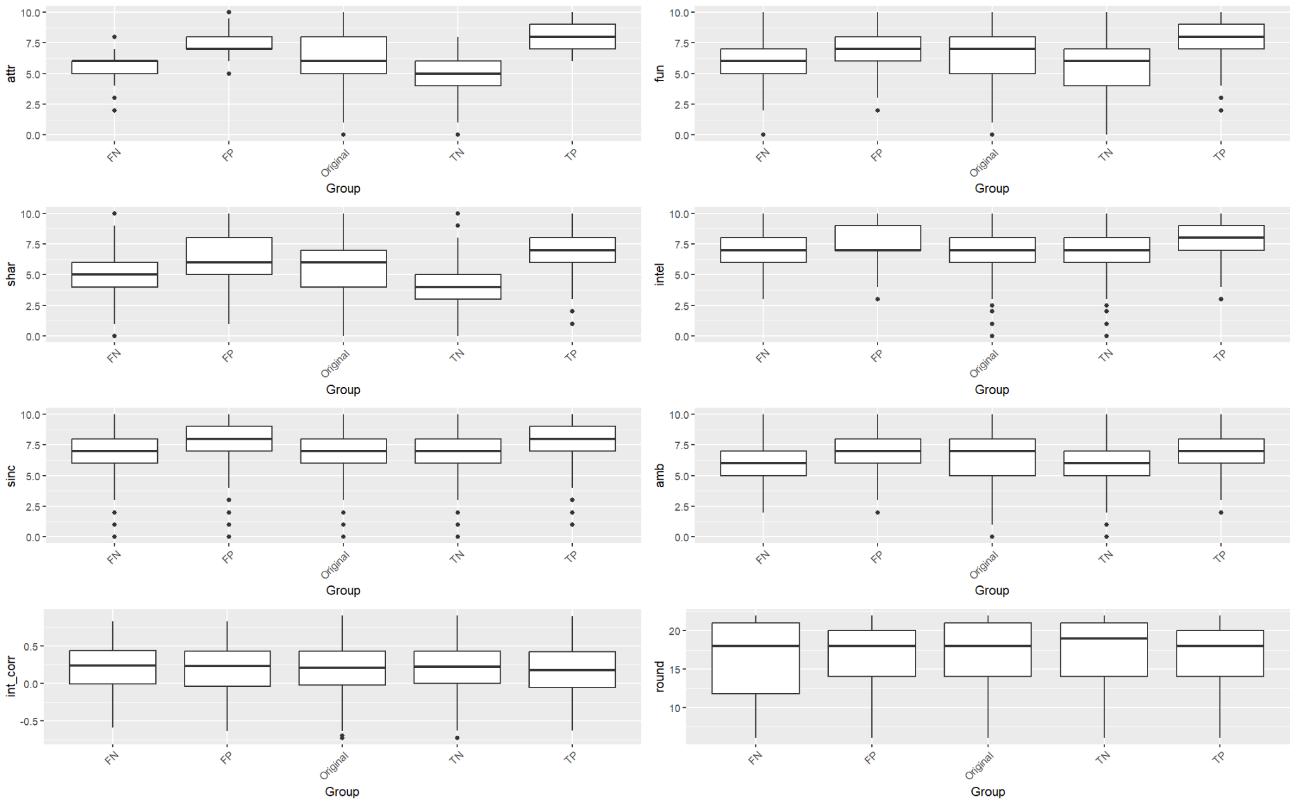
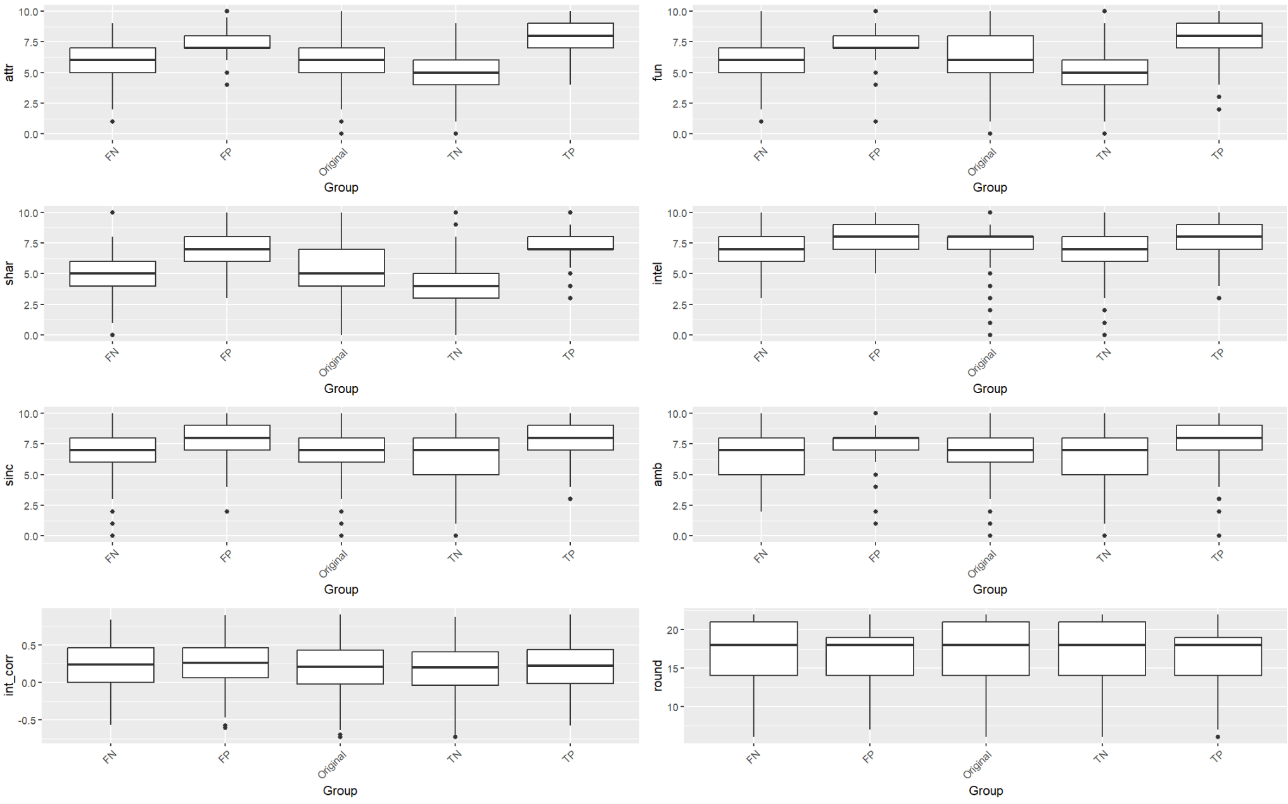
Because the distributions for each of the populations a relatively similar, let us focus our attention on the overall population (figure 5). For attractiveness, the true positive and false positive populations found their dates more attractive than average. The true negative group found dates less attractive than the overall group. The same also holds for (perceived) shared interest and fun (though we found it to be highly correlated with attractiveness). Similar trends hold for the male and female groups as well.
We see that the model makes more accurate predictions for partners with extreme ratings in attractiveness and shared interests. Intuitively, the model strongly relies on these traits to make a prediction, so it has a better chance of predicting participants who rate their date very highly or lowly on these dates. The model had greater difficulty correctly predicting participants who gave their partners more average scores. In these cases, the misclassified participants likely relied on something more complex not accounted for in the model such as a particularly favorable personality quirk, situational context, or overall interaction quality.
Conclusion
In this study, we examined underlying patterns that influence someone to want to go on a second date with their partner. We find a strong relationship between this decision and attributes such as attractiveness and perceived shared interests. Intelligence and true interest correlation do not have a significant impact on this decision, which could possibly be explained by the speed date only lasting 4 minutes. We see that men tend to have less selective preferences than women, evidenced by their much higher ``yes’’ decision rate.
We find a discrepancy between what participants claim to value in the opposite sex and what the logistic model relies on to make predictions. Unsurprisingly, attractiveness was the most influential trait for both men and women. However, women claimed to value intelligence equally or slightly more than attractiveness, which contrasts with the model’s findings. Additionally, there was a difference between perceived shared interest and actual interest overlap for men and women. Perceived shared interest was the second most important variable in our logistic regression model, while actual interest had little effect. This suggests that participants had a limited understanding of common interests and likely acted more agreeable towards people they liked.
The models perform best when participants rate these attributes very highly or lowly. However, the model’s accuracy decreases for participants with average ratings, suggesting that other, more complex factors such as personality traits and interaction quality play a significant role in these decisions.
Further research could entail controlling for other demographics such as age, race, or field of study. This could reveal more nuanced patterns about partner selection.